Article
Introduction to Power BI

This article includes tips and tricks for Power BI.
What is Power BI?
Power BI is a cloud-based data analysis and visualisation tool created by Microsoft, which can easily connect with various data sources. It is simple, user friendly and easy to learn and business users and business analysts can benefit from it. It is mature and robust enough to be used from small organisations to large enterprises.
There are three-parts to Power BI,
- A Windows desktop application called Power BI Desktop.
- An online SaaS (Software as a Service) service called the Power BI service.
- Power BI mobile apps for Windows, iOS, and Android devices.
The workflow in Power BI begins by connecting to data sources in Power BI Desktop and building a report. You then publish that report from Power BI Desktop to the Power BI service. From Power BI services you can share it with business users in your organisation who have a Power BI licence and then create a mobile app. So, users can view and interact on mobile devices. 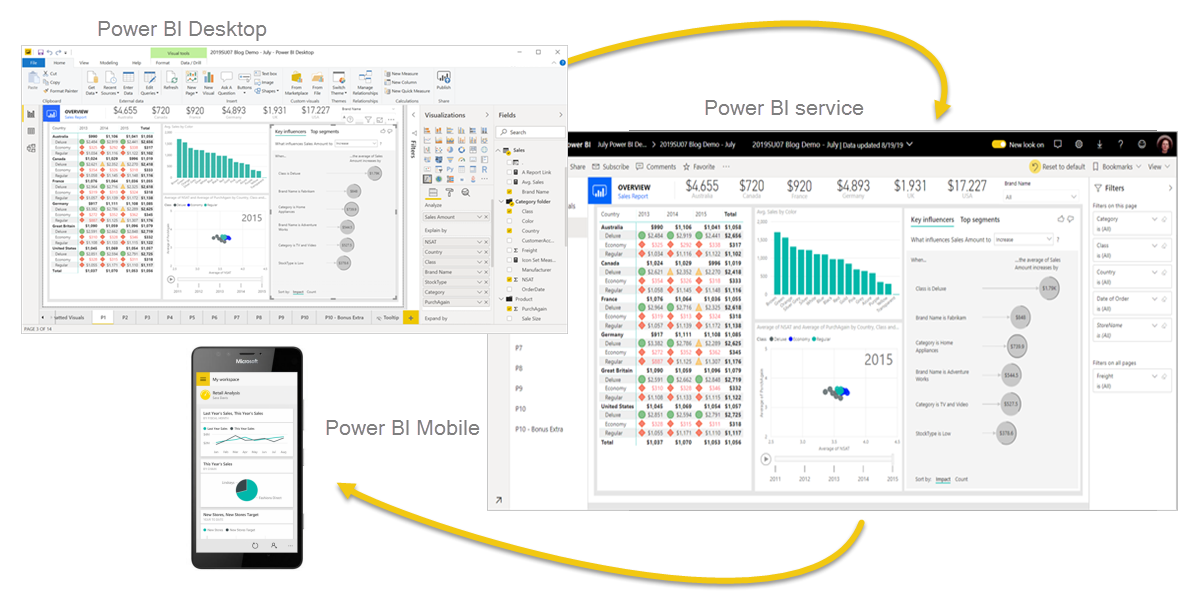
Beyond those three, Power BI also features two other elements:
- Power BI Report Builder creates paginated reports to share in the Power BI service.
- Power BI Report Server, an on-premises report server where you can publish your Power BI reports after creating them in Power BI Desktop.
What is Power BI Desktop?
Power BI Desktop is a free application you install on your local computer that lets you connect to, transform, and visualise your data. With Power BI Desktop, you can connect to multiple different data sources and combine them (often called modelling) into a data model. This data model lets you build visuals and collections of visuals you can share as reports with other people inside your organisation. Most users who work on business intelligence projects use Power BI Desktop to create reports and then use the Power BI service to share their reports with others.
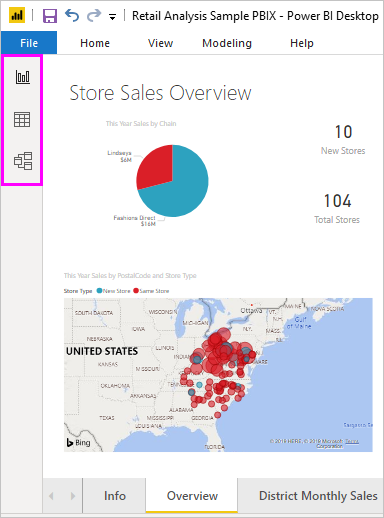
There are three views available in Power BI Desktop, which you select on the left side of the canvas. The views, shown in the order they appear, are as follows:
- Report: In this view, you create reports and visuals, where most of your creation time is spent.
- Data: In this view, you see the tables, measures, and other data used in the data model associated with your report and transform the data for best use in the report’s model.
- Model: In this view, you see and manage the relationships among tables in your data model.
The most common uses for Power BI Desktop are as follows:
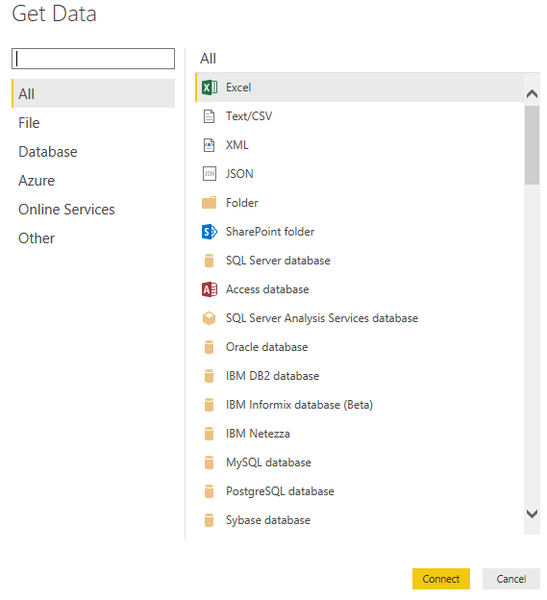
Connect to data:
To connect to data,
From the Home ribbon, select Get Data and then select the source.
Transform and clean data:
In Power BI Desktop, you can clean and transform data using the built-in Power Query Editor. With Power Query Editor, you make changes to your data, such as changing a data type, removing columns, or combining data from multiple sources.
To start Power Query Editor,
- On the Home ribbon, in the Queries section, select Transform data.
- The Power Query Editor window appears.
![]()
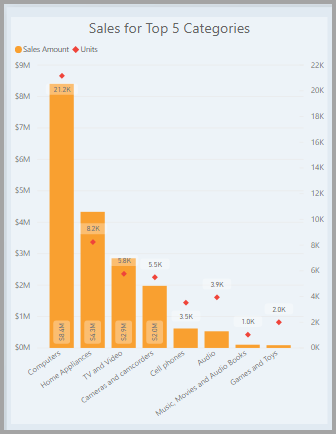
Create visuals:
Once the data model is ready, you can drag fields onto reporting canvas to create visuals, such as charts, graphs that provide visual representations of the data to tell a story.
Create reports:
A collection of visuals in one Power BI Desktop file is called a report. A report can have one or more pages, just like an Excel file can have one or more worksheets.
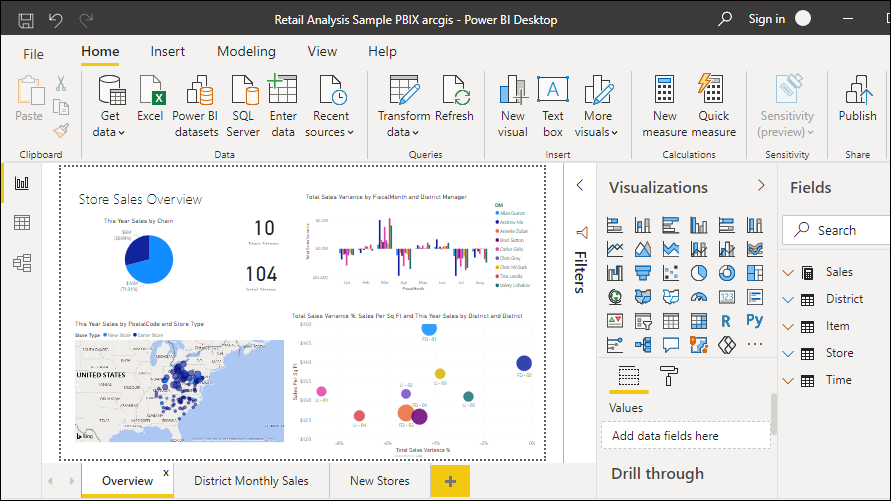
With Power BI Desktop, you can create complex and visually rich reports, using data from multiple sources, all in one report that you can share with others in your organisation.
In the following image, this report has three pages, “Overview”, “District Monthly Sales” and “New Store”.

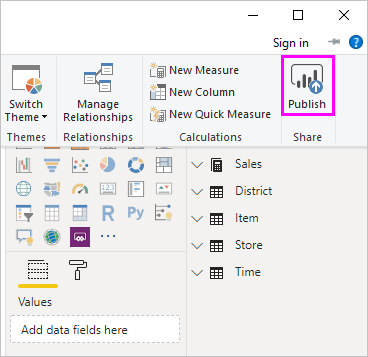
Publish and Share reports:
Once you finish the report, you can publish it on the Power BI service and from there, you can share it with anyone in your organisation who has a Power BI licence.
To publish a report,
From the Home ribbon, in the Share section, select Publish.
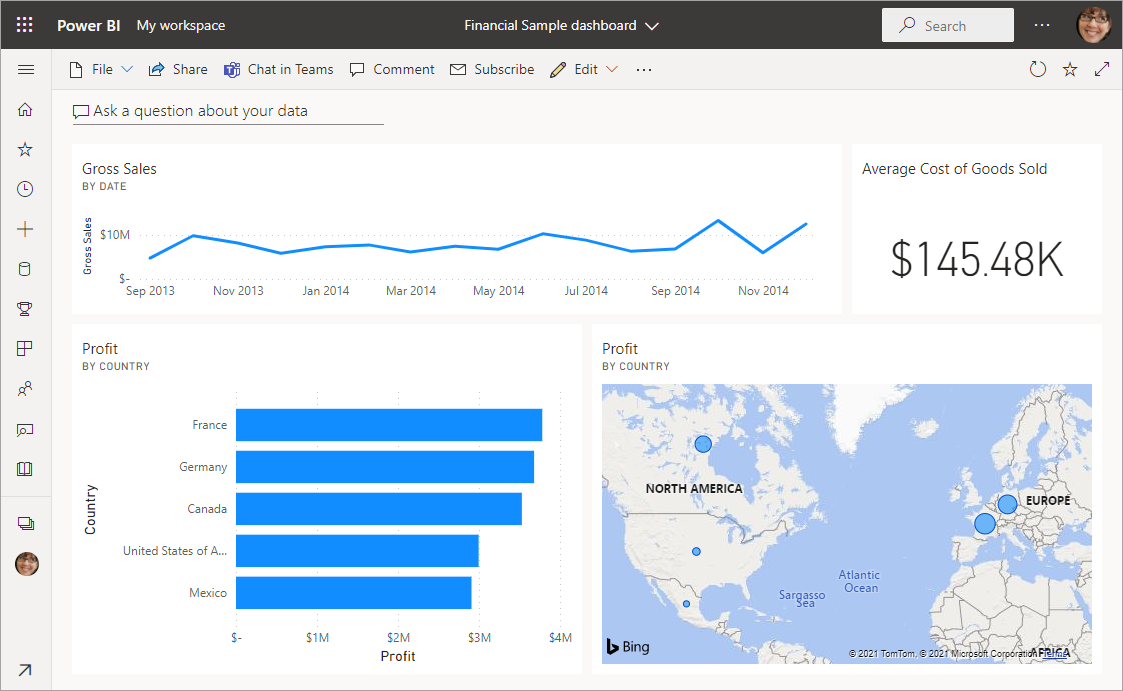
What is the Power BI Service?
The Power BI service is a cloud-based service where you can share and work collaboratively with team mates. In the Power BI service, you can create dashboards from your published report, create and share apps, analyse and explore data to uncover insights.
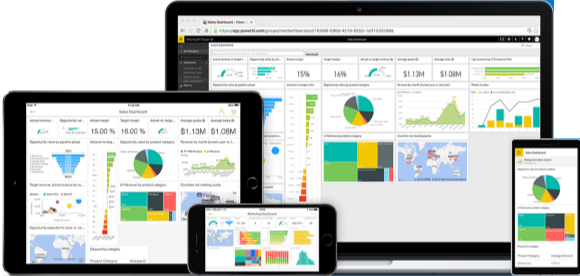
What are Power BI mobile apps?
Power BI offers a set of mobile apps for iOS, Android, and Windows 10 mobile devices. In the mobile apps, you connect to and interact with your cloud and on-premises data.
This blog is an overview of what Power BI can do. If you would like to know more in detail, here’s the link to the Microsoft documentation.
https://docs.microsoft.com/en-us/power-bi/fundamentals/power-bi-overview